Key Findings
The third quarter discussions and survey results indicate that a continued focus on credit risk management practices and concentration risks is warranted and has continued across most regions. However, there are indications that liquidity levels are tightening. With this tightening, examiners report that banks’ liquidity positions and contingency funding plans are garnering more supervisory attention.
Summary of Findings
|
As these and other issues are researched over the coming months, readers of this series should expect periodic Spotlight publications, which will provide deeper analysis and perspective on each topic.
Quarterly Changes
here has been a gradual and continual trend of loosening underwriting standards as reported by examiners. While difficult to measure quantitatively, examiners are asked anecdotally whether underwriting standards seem to have tightened, loosened, or remained stable from the prior quarter. In this quarter, 47 percent of examiners reported some loosening of standards over the prior quarter. As the chart below shows, a significant portion of examiners continue to observe quarter-after-quarter loosening of underwriting standards. Along with the continued loosening of underwriting standards, examiners report that they increasingly observe more accommodative credit decision-making.
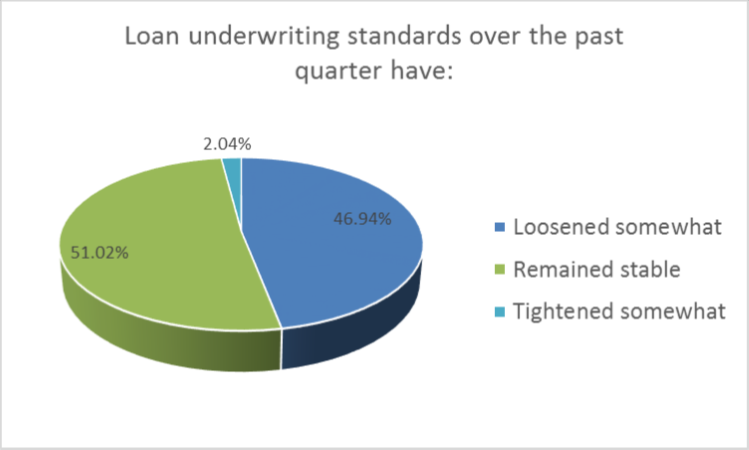 Loan Underwriting Standards, as Assessed by Bank Examiners
In targeted discussions with examiners, the overall sentiment is that the lending environment is becoming more accommodative. The following specific observations were highlighted in these discussions:
- An increase in the number of loan policy exceptions cited during examinations,
- Banks’ increasing willingness to waive guarantor requirements,
- A return of interest-only credit facilities in certain markets,
- Amortization periods that are longer on new loans than existing loans, despite the fact that new loans appear to have higher risk characteristics than existing loans,
- Revising loan policies to accept lower debt-service-coverage ratios, and
- Highly competitive markets.
 Indeed, over 40 percent of respondents reported that lending practices, such as pricing and/or amortization, have become more accommodative over the past quarter. There are important regional differences with respect to this trend.
The observations driving these trends seem to be most common in districts 2, 3, and 5—the upper Midwest, Southeast, and West coast, respectively. District 4, which is dominated by the agricultural and energy production sectors, do not seem to be exhibiting the same trends. In fact, a small portion of examiners from District 4 observed that banks are tightening their lending parameters, likely in response to declining farm profitability and low oil and gas production.
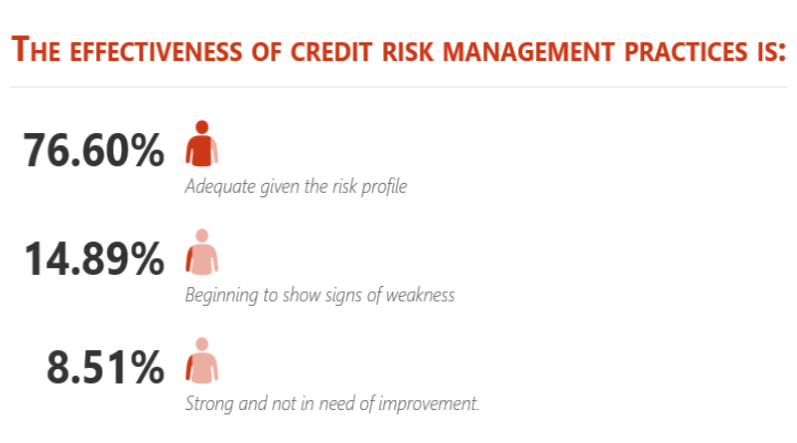
While these trends are cause for some concern, examiners nationwide continue to report that credit risk management practices are adequate given the risk profile within the institution’s credit portfolio.
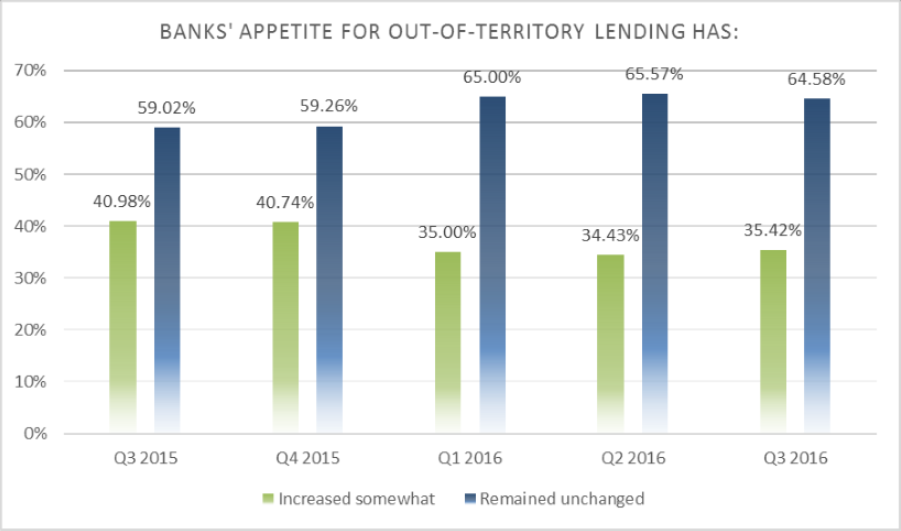 Bank Appetite for Out of Territory Lending, as Assessed by Bank Examiners
As the figure at the right illustrates, banks’ apparent appetite for credit participations and other out-of-territory loans remains elevated. Over 35 percent of examiners reported an increase from prior periods. Reports are consistent across most CSBS districts, i.e., banks continue to look out-of-territory for lending opportunities given the attractive yield many outlets offer. The only district where this trend did not hold true was District 4. Examiners there observed much lower levels of interest in this type of lending.
Regionally, low commodity prices have resulted in increasing reports of farm carryover debt—the portion of an operating loan unable to be paid by operating income. Examiners from these areas report that weak farm performance is now responsible for the second consecutive season with elevated levels of carryover debt and many are expecting 2016 to follow a similar track.
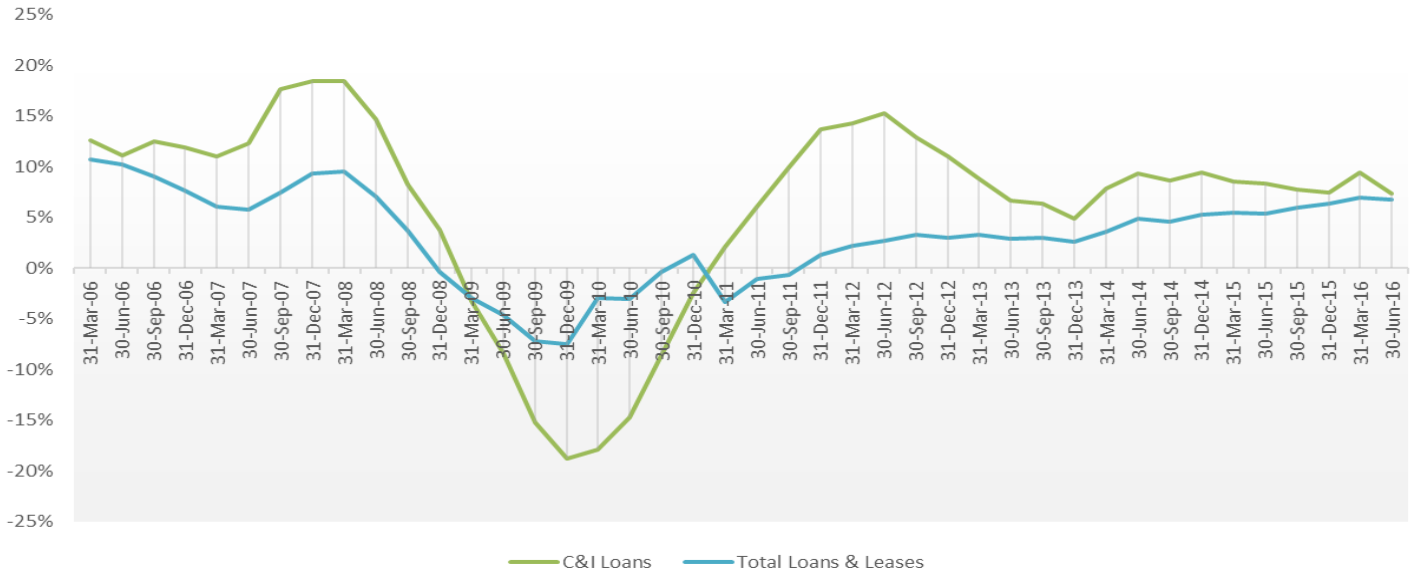 Twelve Month Growth Rate of C&I Loans and Total Loans. Source: FDIC Quarterly Banking Profile
Similar to previous quarters, banks seem to be pursuing a handful loan types with more vigor than others, those being commercial and industrial and the commercial real estate segments of office and retail. Commercial & industrial loans, in particular, have outpaced the growth rate of the loan portfolio as a whole, as the chart on the prior page illustrates. In discussions with examiners, it seems growth in the commercial and industrial segment is concentrated in certain markets, particularly the upper Midwest. Despite the regional variance, the trend for all banks reveals that growth in the segment, while slowing, continues to slightly outpace the growth of most loan types.
Trends in banks’ credit portfolios commanded much focus over the past several quarters, especially in markets where lending activity has returned to more normal levels. As a natural outcome of this trend, examiners are now expanding supervisory focus on banks’ liquidity positions and funding plans. As one would expect, the return of loan demand to more healthy levels has caused a tightening of liquidity positions. While the general trend has been one of decreasing on-balance sheet liquidity and more reliance on non-core funding sources, liquidity positions and asset/liability management strategies vary significantly from institution to institution. A common measure of liquidity is the loan-to-deposit ratio. Industry-wide, this ratio was 71.2 percent for banks less than $1 billion and 79.2 percent for banks over $1 billion as of June 30, 2016 according to the FDIC’s Quarterly Banking Profile. This ratio is down significantly from pre-crisis levels when many banks exceeded 90 percent. That said, examiners are closely monitoring liquidity positions, funding strategies, and the adequacy of contingency funding plans given the modestly tightening positions. There is significant regional variation in liquidity levels. In many states in the Northeast and mid-Atlantic, a majority of banks have loan-to-deposit ratios in excess of 75 percent. In the Southeast, on the other hand, the portion of banks that exceed the 75 percent level is considerably smaller.
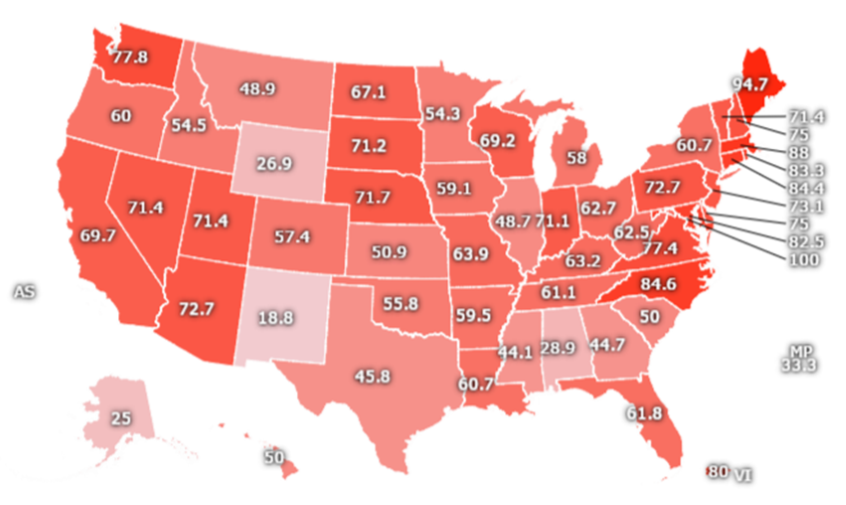 Percentage of State-Chartered Banks with Loan to Deposit Ratio Greater than 75%
As a source of liquidity and earnings, the investment portfolio’s risk profile and maturity structure are important components of a liquidity assessment. There has been little movement in trends on the investment portfolio, i.e. examiners report that new investments are not changing the overall risk profile or the maturity horizon of the portfolio.