The banking industry continued to exhibit signs of greater liquidity stress through the third quarter of 2016. However, the type of liquidity risks faced by banks seems to differ based on their size and business model. For instance, while small banks are showing signs of tighter on-balance sheet liquidity, larger banks (particularly thrift institutions) are showing an increased dependence on noncore funding and reliance on wholesale funding not present among smaller banks.
| Liquidity Metric | Risk Benchmark |
|---|---|
| Loans to Deposit Ratio | > 75% |
| On-hand Liquidity to Total Liabilities Ratio | <15% |
| Net Non-Core Funding Dependence Ratio | >10% (thrifts); >20% (banks) |
| Wholesale Funding Reliance Ratio | >15% |
| Net Short-Term Liabilities to Total Assets | >15% |
By examining a handful of liquidity ratios, this Risk Spotlight intends to provide an overview of what types of liquidity risks are emerging at institutions of different sizes and business models. This report uses a set of liquidity metrics to examine different types of liquidity risks and assigns a risk benchmark to each metric to gauge the degree of liquidity risk present.
Additionally, the Appendix that follows provides a geographical perspective on where in the country different types of liquidity risks are emerging among state chartered banks.
On Balance Sheet Liquidity
On balance sheet liquidity continued to tighten for certain banks through the third quarter of 2016. In particular, banks with less than $500 million in total assets (“small banks”) experienced elevated liquidity stress relative to all banks across the country. Increasing to a level not seen since the second quarter of 2009, the average loan-to-deposit ratio for small banks increased 53 basis points (bps) quarter over quarter and 200bps year over year, while, across all U.S. banks, the average loan-to-deposit ratio decreased by 65bps quarter over quarter and rose by only 8bps year over year.
The heightened loan to deposit ratio for small banks can be primarily attributed to loan growth consistently outpacing deposit growth quarter over quarter.
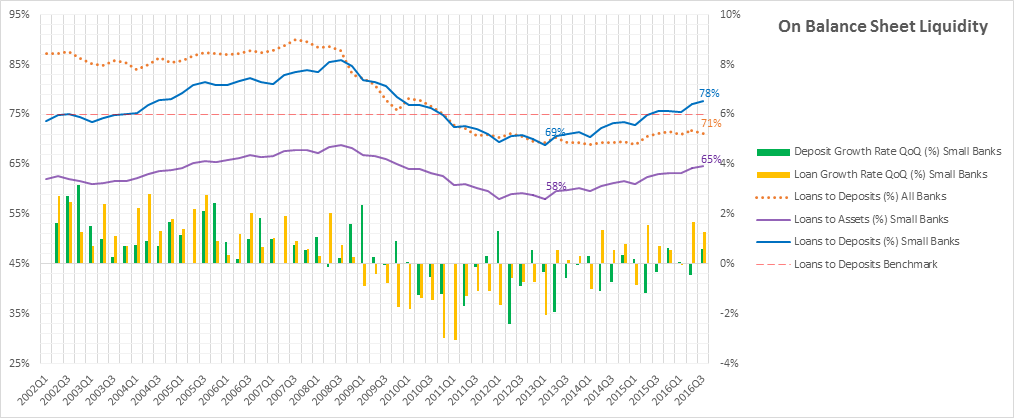
Additionally, as the deposit structure of small banks played a smaller role in funding their loan portfolios, the asset composition of small banks shifted further towards loans. This has exacerbated the tightening of liquidity among small banks.
The potential vulnerability of small banks with limited on-balance sheet liquidity to credit-sensitive funds providers, particularly at less favorable points in credit and economic cycles, will be closely monitored by regulators.
Noncore Funding and Wholesale Funding
Although balance sheet liquidity is tightening for small banks, this trend has yet to materialize into higher dependence on noncore funding or wholesale funding for these banks.
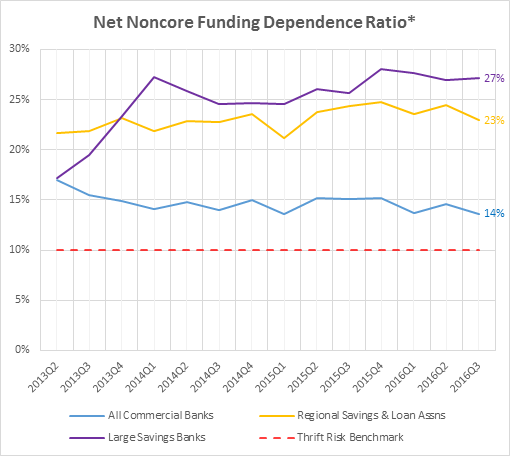
*Non-core liabilities less short-term investments divided by long-term assets
Net noncore funding dependence among all commercial banks likewise remains well below the risk benchmark for commercial banks of 20%. Thrifts, on the other hand, are exhibiting a higher reliance on noncore funding. In particular, savings banks with assets above $10 billion (Large Savings Banks) and savings and loan associations with assets above $1 billion but below $10 billion (Regional Savings & Loan Associations) are becoming increasingly dependent upon noncore funding, well above the risk benchmark for thrifts of 10%.
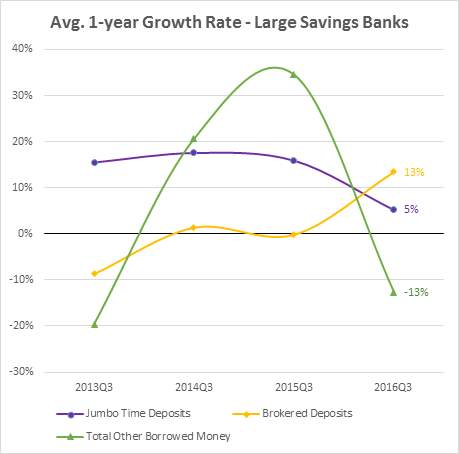
Drilling down into growth trends of noncore funding for large savings banks, it can be seen that they have been consistently dependent on jumbo time deposits and have become increasingly reliant on brokered deposits.
Reliance on Wholesale Funding
The increased dependence on noncore funding among large savings banks mirrors an increased reliance on wholesale funding among all banks with assets between $10 billion and $50 billion (Large Banks).
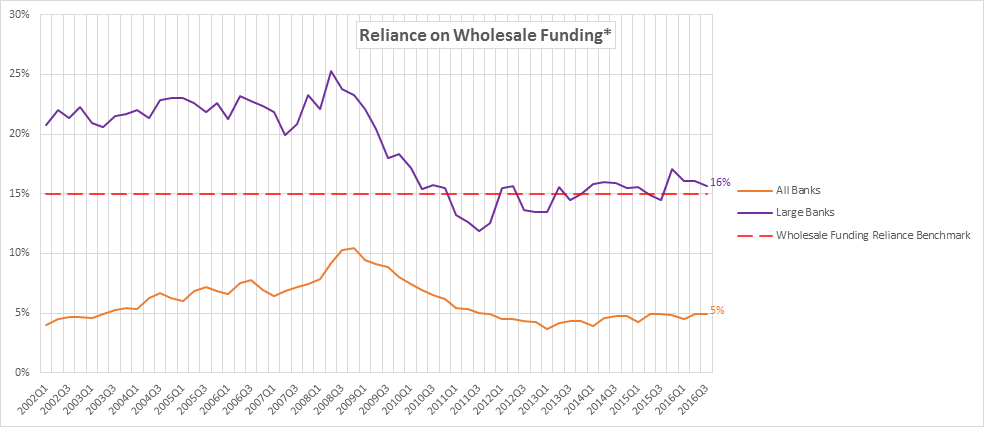
*Total borrowings plus brokered deposits divided by total borrowings plus total deposits
Although large banks are not relying on wholesale funding at pre-crisis levels, they have remained above the risk benchmark of 15% throughout 2016. Small banks, on the other hand, continue to exhibit a reliance on wholesale funding between 100 and 200bps below the industry average.
It is possible that the greater reliance of large banks’ on wholesale funding sources can be attributed to an absence of local deposit funding or a desire for greater flexibility in managing their asset-liability positions. Regardless, given that wholesale sources tend to be credit sensitive, the increased reliance on wholesale funding among larger banks presents a clear liquidity risk.
Short Term Assets to Liabilities
While balance sheet liquidity is tightening for small banks and wholesale and noncore funding reliance is increasing among larger banks, no segment of or peer group within the industry is exhibiting a high degree of exposure to rollover risk from funding assets with short-term liabilities.
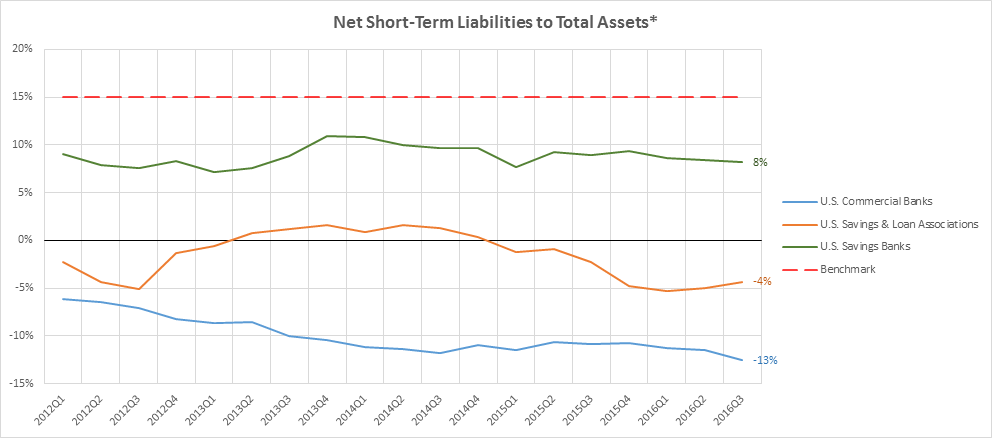
*Short-term liabilities minus short-term assets divided by total assets.
Generally, the higher the ratio of net short-term liabilities to assets, the more vulnerable a bank is to funding sources rolling out. Although there is evidence of rollover risk on aggregate basis, examiners should be aware of isolated situations at individual banks that may be funding assets with short-term liabilities and thus be exposed to greater rollover risk.
Please reference the accompanying maps in the appendix to assess what percentage of the banks chartered by your department have a level of net short-term liabilities to total assets above the risk benchmark of 15%.