Over the past year, Risk ID Team members in certain states have reported that apartment vacancy rates are on the rise in their local rental markets.
Key Findings
|
How are Vacancy Rates Calculated?
An apartment’s vacancy rate is the numerical value calculated as a percentage of total available units in a rental property that are vacant or unoccupied at a given point of time. Vacant apartment units include those that are empty and ready to be rented, units that have not been returned to the market following the exit of a tenant, or units that are not currently rentable because they are in need of repairs or renovations. The occupancy rate is the opposite of vacancy rate, and both values should add up to 100%.
National Rates do not Tell the Whole Story
Tracked by the census department, the national vacancy rate is included within the index of leading economic indicators. The current national rate of 7% is the second lowest quarterly value since the high mark of 11.1% in Q3 2009, and it has held relatively steady over the past two quarters.
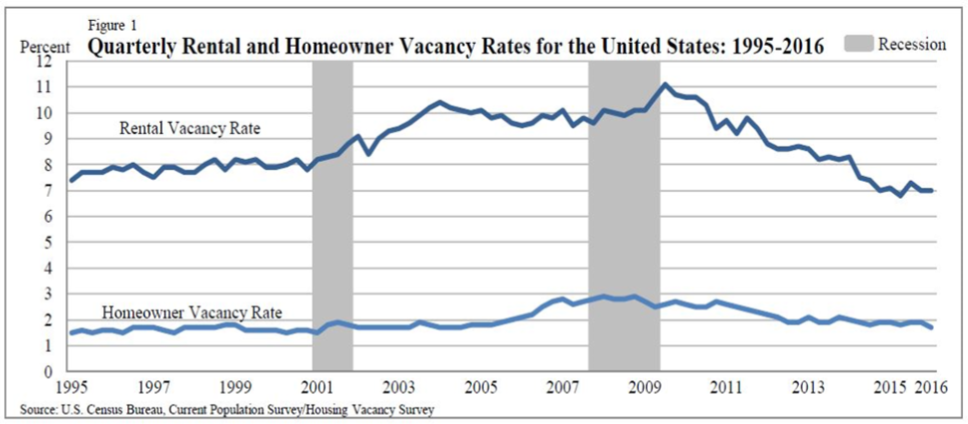 Figure 1
While the rate provides a useful snapshot of current economic conditions on a national level, it is important to consider that there is significant variation in vacancy rates across states, MSAs and property types. As identified by members of the Risk ID team, vacancy rates in many local markets have increased over the past two quarters as new construction in high-rent urban areas has outpaced demand.
Rental market climate, construction and vacancy rates by building type
As of Q3 2015, Americans occupied approximately 42.6 million rental housing units. Since 2005, the United States has seen the creation of 9 million new households, representing the largest increase in any 10 year period on record. Job growth and recent economic recovery have contributed to an increase in size of the renter population which in turn has led to lower vacancy rates and growth in rent values in many areas of the country. Despite this demographic shift, both rental demand and home sales are at levels below those typically seen when job production is trending positively. Stagnant wage growth in recent years has limited the mobility of many households. The share of apartment renters who are opting to remain in place when their leases expire is at record levels. 55.1% of apartment leases that reached their expiration point in February 2016 were renewed.
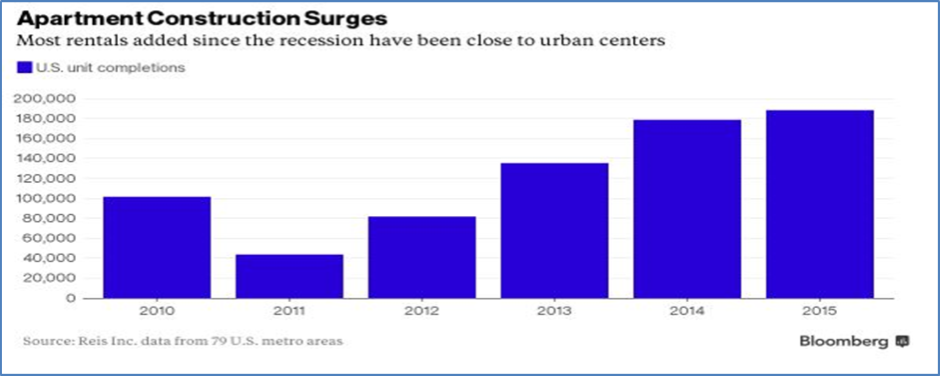 Figure 2
There are signs that the bull market for apartments, which kicked-off in 2010, is not sustainable in the long term. The number of apartments added to the market hit a 27 year high in 2015 More than 900,000 units were constructed over the past three years, and developers are expected to build an additional one million units through 2019. Ryan Severino, Senior Economist at REIS noted that, “we can’t keep building and building and building and not see weakness enter the market.”
Developers are continuing to push forward with apartment construction despite a glut of supply in many urban areas. According to data from the National Apartments Association, the occupied apartment count across the nation’s 100 largest metro areas increased by 20,077 units in the first quarter of 2015. This is less than half the typical demand for 40,000 to 50,000 units seen in the first quarter of the previous three years. Developers added more than 65,000 completed units in Q1, significantly outpacing demand. This gap in absorption is expected to widen over the next five years.
Since the recession, the vast majority of apartment buildings constructed in the United States were Class A properties. Class A properties are generally new buildings near city centers that are aimed at high-income professionals. According to REIS, developers have delivered approximately 1 million new Class A units since early 2007. To the contrary, there have been zero completions of new Class B and C apartments since 2012, following the addition of approximately 44,000 units from 2007 to 2011. Economists at REIS have stated that it is taking longer than in previous years to lease these new, expensive units.
Nationwide, vacancy rates at Class B and C properties has decreased from 4.3% to 3.2% nationwide (for large markets covered by REIS data) over the past three years. This has contributed to the stability of the nationwide vacancy rate. Meanwhile, Class A vacancies have climbed from 4.6% to 5.7% over the same time period. This has led to increased investor demand for Class B apartment buildings. Large investors are purchasing and renovating Class B buildings across the country. Properties in the Class B group are less than 20 years old, with exterior and interior amenity packages that are lower in quality than what is offered at the higher range of the market. Investment firms have described class B buildings as recession-proof.
Blackstone, the world’s largest private equity firm has invested approx. $14B in older apartments in the past three years. Equity Residential, the largest owner of rental properties in the United States recently sold a group of suburban buildings in South Florida and Denver to Starwood Capital Group for $5.4B. L.A. based investment firm, TruAmerica Multi-Family purchased $1.8B in apartment buildings in 2015, three quarters of which were Class B. The capitalization rate for the class B properties—a measure of investment yield—was 5.5%. Generally, the cap rate for Class B properties is 1% higher than for Class A properties.
Regional Variance in Vacancy Rates
In Q1, vacancy rates increased across most individual metro areas in the United States. According to census data, there is significant variance in vacancy rates across states and MSA’s. The MSA with the highest vacancy rate in Q1 was Dayton, OH, at 18.3%. The city’s vacancy rate almost doubled in Q1 2016. New Orleans, Birmingham, Oklahoma City, Akron, and St. Louis follow economically-distressed Dayton as the MSA with the highest vacancy rates in Q1 2016.
Within a single state, the level of variance is often very high, even among cities that share similar demographics and economic challenges. Despite having the MSA with the highest vacancy rate, Ohio also contains the Cleveland MSA, which has the fifth lowest vacancy rate of the top 75 MSA’s at 3.1%.10 In addition, the college town of Columbus Ohio has been referred to as the one of the hottest rental markets in the country. The vacancy rate in Columbus is expected to hit a 16 year low of 4.5% by the end of 2016. The rental market in Columbus is supported by job growth that is aligned with supply growth. Svenja Gudell, Chief Economist for Zillow, said “in Columbus, you are able to rent out everything being built, whereas in San Francisco, for example, when you think of hot rental markets, they are building more apartments but they are very high-end and take longer to rent out.”11 Most new developments in Columbus are fully leased upon completion.
Census data shows that vacancy rates are highest outside of MSAs, where they averaged 9.6% as of Q1 2016. Regionally, rates are highest in the south (8.8%), followed by the mid-west (7.7%). Rates are lowest in the northeast (5.4%) and west (5.1%). Among states, Alabama has the highest average vacancy rate (14.9%), closely followed by North Dakota (14.6%). New Hampshire (2.5%) and Massachusetts (3.5%) have the lowest average vacancy rates.
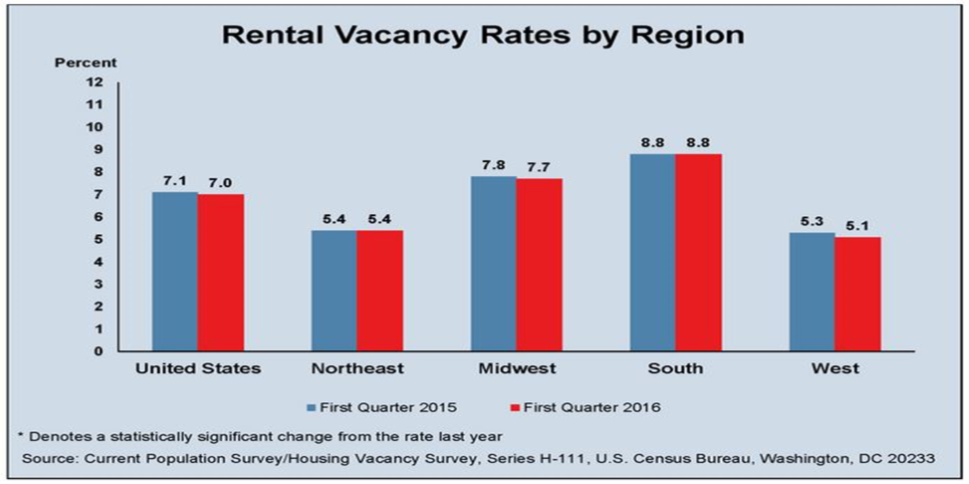 Figure 3
Among major metro areas, San Francisco, New York, Houston, and Denver are seeing their rental markets soften due to a surge of new construction. Denver, in particular, saw sharp increases in apartment vacancies in the third and fourth quarters of 2015. According to the Denver Post, the vacancy rate in the Denver Metro area has increased from 5% as of Q3 2015 to 6.8% as of year-end. Q4 is typically a slow period for apartment rentals, but the jump was far beyond any normal seasonal adjustments. Areas with concentrations of high-rent apartments, including northwest Denver, Boulder, and Downtown, have reached vacancy rates of 17.4%, 14%, and 11.2% respectively. The more affordable areas of metro Denver, including Wheat Ridge (2.6%) and Eaglewood (3.3%) have much tighter rates, supporting the argument that over-supply exists at the high end of the market. Areas with strong student demand, including Boulder’s University Hill (2.7%), have very low vacancy rates. Given Denver’s strong in-migration, it is unlikely that rising vacancy rates will lead to a market crash. However, Denver, along with several metro areas in Texas, are likely to have their rental markets negatively impacted by decreasing oil prices and the resulting slowing of employment growth.
Vacancy Rate Impact on Rental Values
Generally, the tipping point at which vacancy rates impact rental prices is 5%. If higher, landlords need to offer incentives or lower prices to attract tenants. If higher than 5%, landlords know that many renters are willing to fill a unit if a tenant leaves.15
Nationwide, the increase in vacancy rates in the first quarter did not slow the upward trajectory of rents. Rent prices increased .9% in Q1, which is slightly stronger than the increases seen in the first quarter of the past three years.16 With the increase in Q1, the annual effective rent growth eclipsed 4% for the seventh straight quarter. Declines in rent growth in the Bay Area of California, New York, Denver, and Houston, are being off-set by significant gains in rent prices in secondary markets, including Orlando, Sacramento, and Salt Lake City.
Metro areas with increasing vacancy rates are seeing a leveling-off or lowering of average rents. Denver’s average unit rental cost held steady over the past two quarters at $1,292.18 Developers in these expensive urban markets are increasingly offering concessions such as a month or more of free rent. In Manhattan, 14% of rentals included concessions compared to 5% a year ago.19 The Houston market, which is overwhelmed with new rental housing, has seen slowing rental price growth in 13 of the past 14 quarters. San Francisco, which was recently the nation’s second hottest rental market, is now ranked 20th. Middle-class renters are likely to continue to experience rising rents in most U.S. rental markets.