Adapting to the Digital Age: Community Bank Tech Usage
Blog 3 of 7: Tech Usage
By CSBS Chief Economist Thomas F. Siems, Temple University Professor of Finance and CSBS Adjunct Research Scholar Jonathan A. Scott and Federal Reserve Bank of St. Louis Supervision Policy, Research and Analysis Manager Meredith A. Covington
Adapting to the Digital Age Series
- Blog 1: Macroeconomic Forces
- Blog 2: Competitive Forces
- Blog 3: Tech Usage
- Blog 4: Is Tech an Opportunity or a Threat?
- Blog 5: How are Core Services Providers Viewed?
- Blog 6: Tech Investment and Mergers and Acquisitions
- Blog 7: Community Bankers’ View of Technology
In this seven-part blog series, we explore how community banks are adapting to a changing digital landscape by analyzing banking and technology questions from the 2021 CSBS National Survey of Community Banks. Survey results are presented each fall at the annual Community Banking in the 21st Century Research and Policy Conference, sponsored by CSBS, the Federal Reserve and the Federal Deposit Insurance Corp.
In the third installment in this series, we examine which tech-enabled products community bankers use as well as the intensity of usage.
Tech Usage
Technology-enabled products and services have become a necessary strategic focus for community banks to remain competitive.
This focus was true prior to the 2020 pandemic but accelerated as bankers were forced to rethink the role of their branch offices by offering more remote services to their customers. One recent example that showed how community banks played an outsized role was with the Small Business Administration’s roll-out of Paycheck Protection Program.
So, how are community bankers using tech-enabled products and to what extent? And how has tech usage changed over time?
Defining Tech Usage
The definition of technology, or tech usage, is neither straight forward nor uniformly agreed upon because of its many internal and external dimensions. Internally, tech usage can refer to core system infrastructure and vendor add-on products that provide capabilities for product delivery, compliance and regulatory reporting. On these same platforms, the external dimension is the capability for banks to offer web-based and mobile banking products to business and household customers.
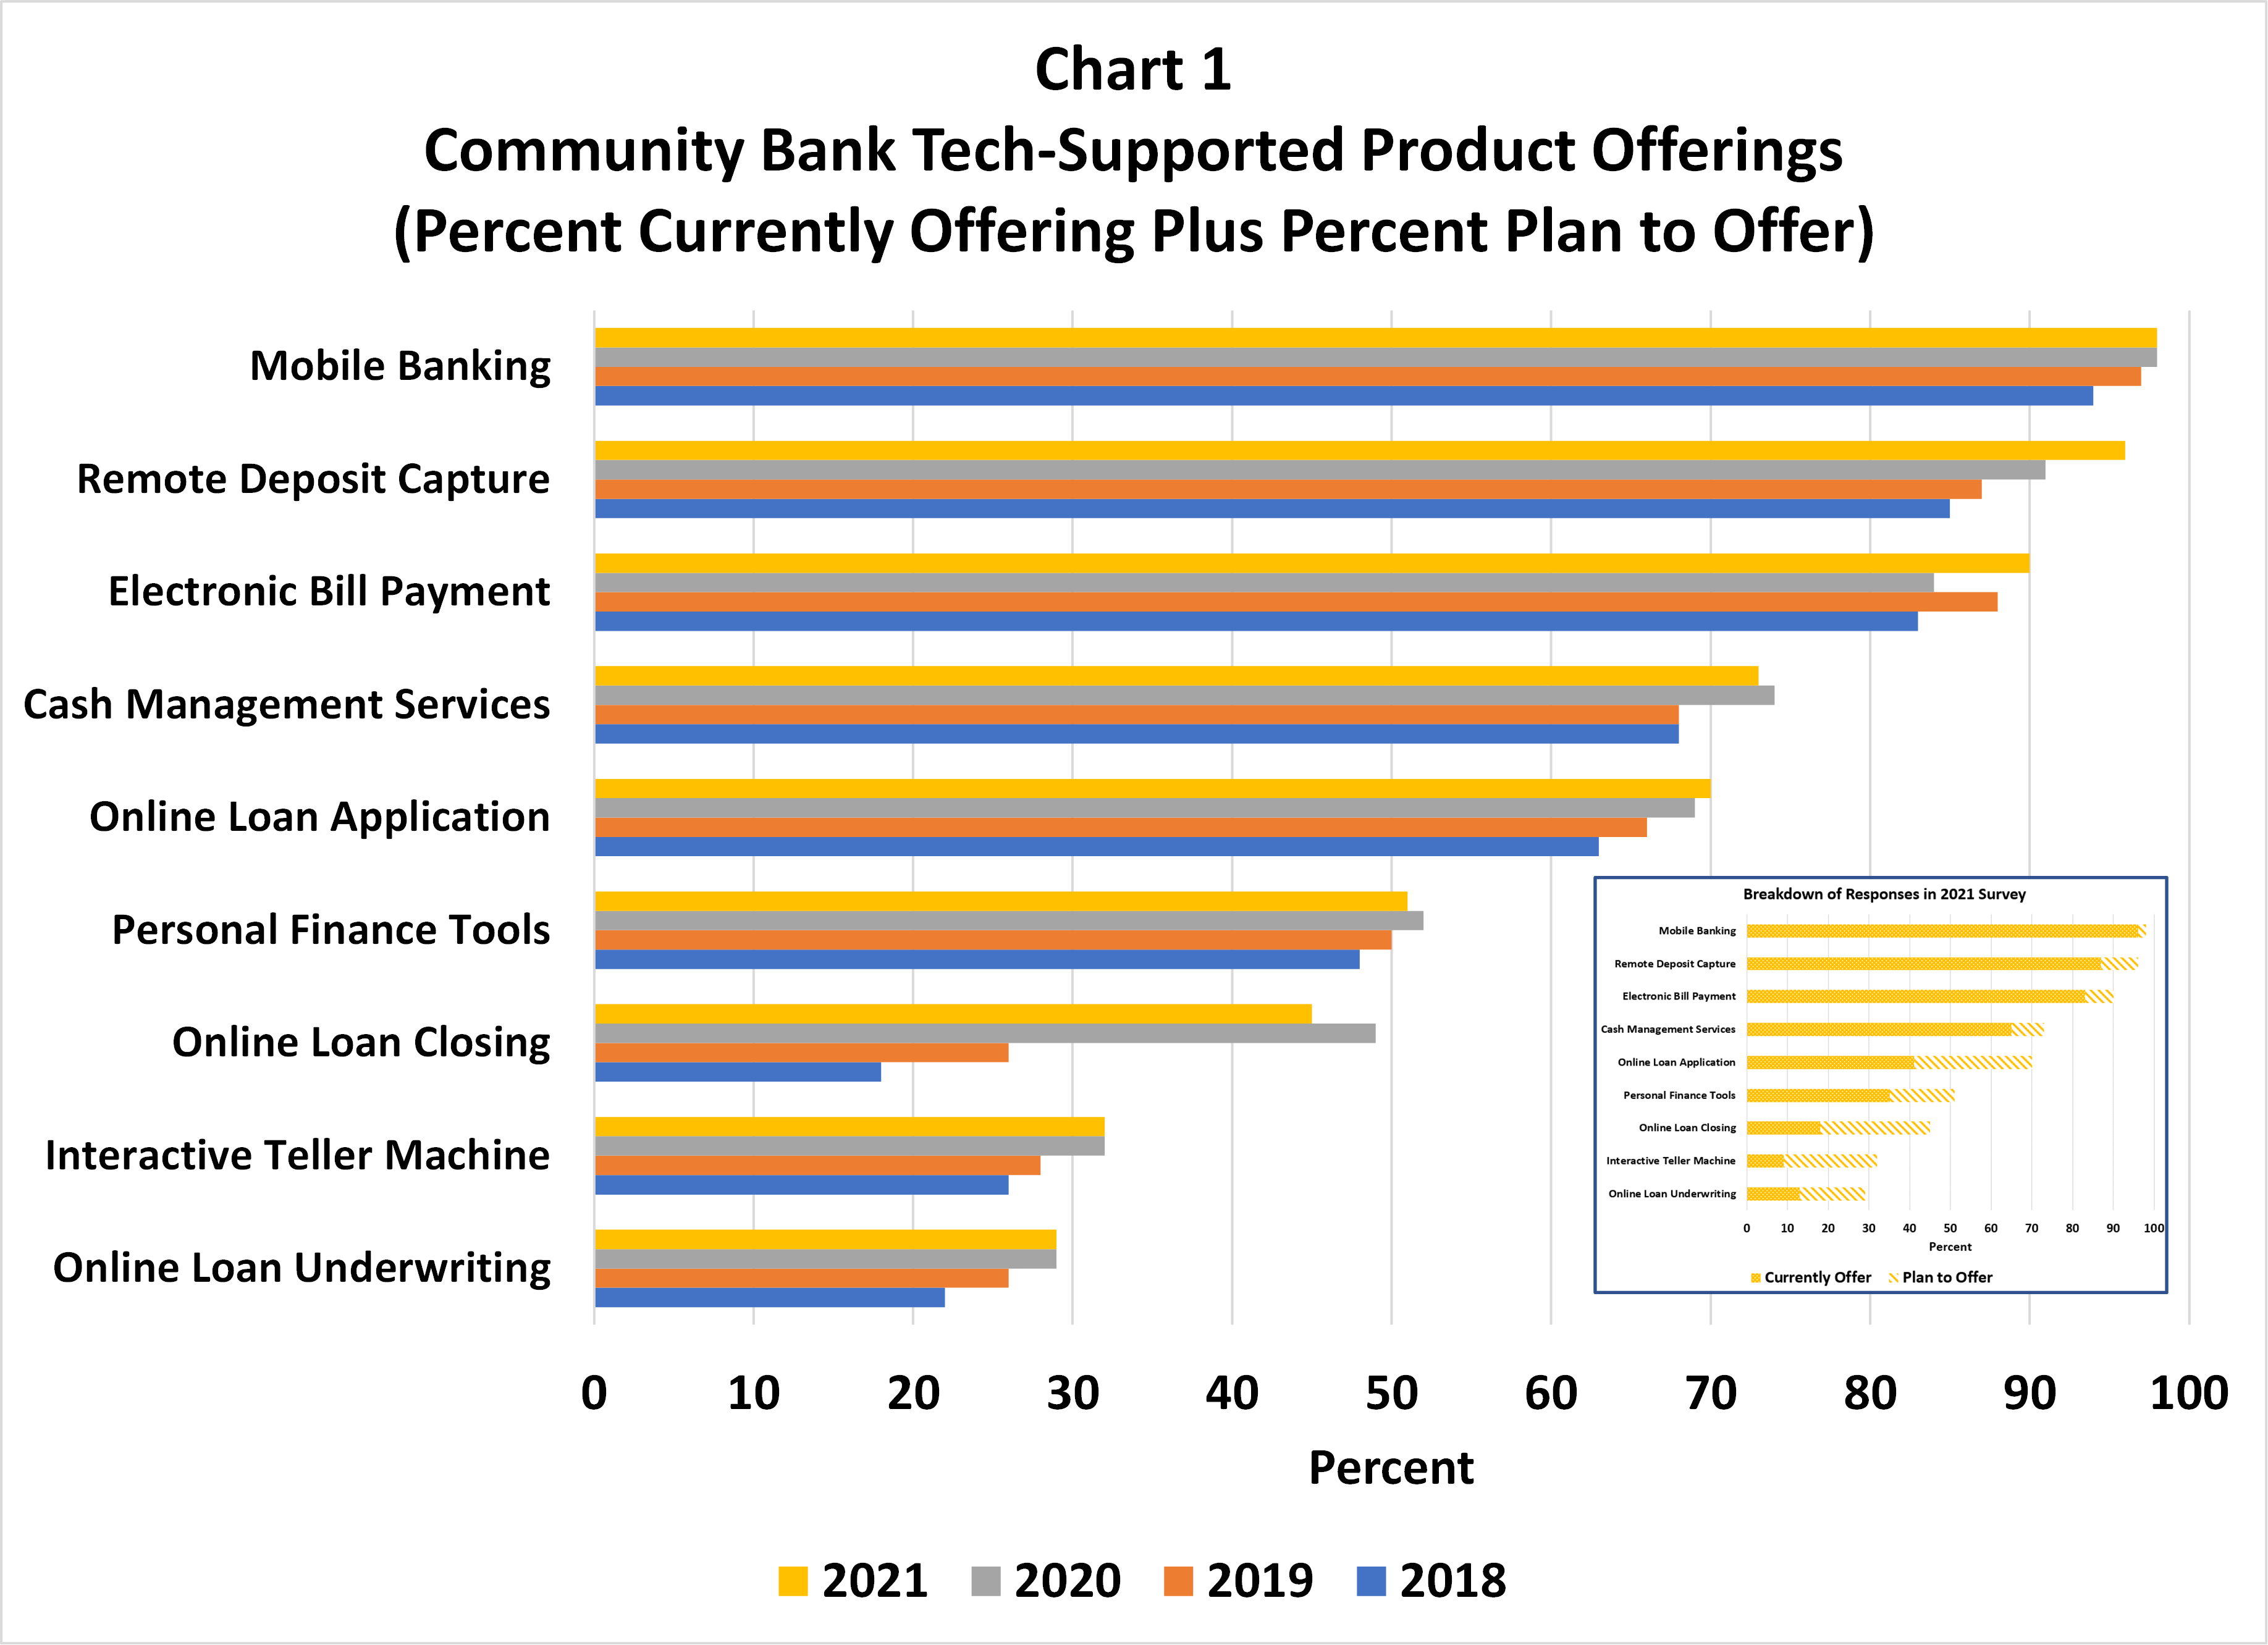
For this report, we follow a similar approach used by the FDIC, although we define tech usage strictly on the basis of the number of product/service offerings that have been part of the annual national surveys since 2018. These service offerings include online loan applications, automated loan underwriting, online loan closing, mobile banking, electronic bill payment, remote deposit capture, intelligent teller machines (ITMs), cash management services and personal financial management tools (PFM). Respondents were given four choices for plans over the next 12 months: “Currently offer and will continue to offer,” “Currently offer but plan to exit,” “Do not offer and no plan to offer,” and “Do not offer now but plan to offer.” A product is counted as “offered” if the bank reported “Currently offer and will continue to offer” or “Do not offer now but plan to offer.” Unlike the FDIC, we define tech usage strictly on the basis of the number of products used from the list above.

As shown in Chart 1, at 98%, mobile banking is the most frequently offered service in 2021, up from 94% in 2018. The next most frequently offered 2021 community bank products are remote deposit capture (96%), electronic bill payment (90%) and cash management services (73%), all showing increases since 2018. The less frequently offered 2021 community banking products in order of importance are online loan applications (70%), PFM tools (51%), online loan closing (45%), ITMs (32%) and automated loan underwriting (29%). The biggest uptake since 2018 has been online loan closing enabled by e-signature capabilities, increasing from 18% to 45%. Plans to offer online loan applications remains high, at 70%.
We define the extent of tech usage as the number of products used. Chart 2 shows the distribution of the total number of products used. A low tech-usage bank is defined as one that “currently offers and will continue to offer” fewer than four of the nine products listed above. A moderate tech-usage bank offers four to five products, and a high tech-usage bank offers more than five products.
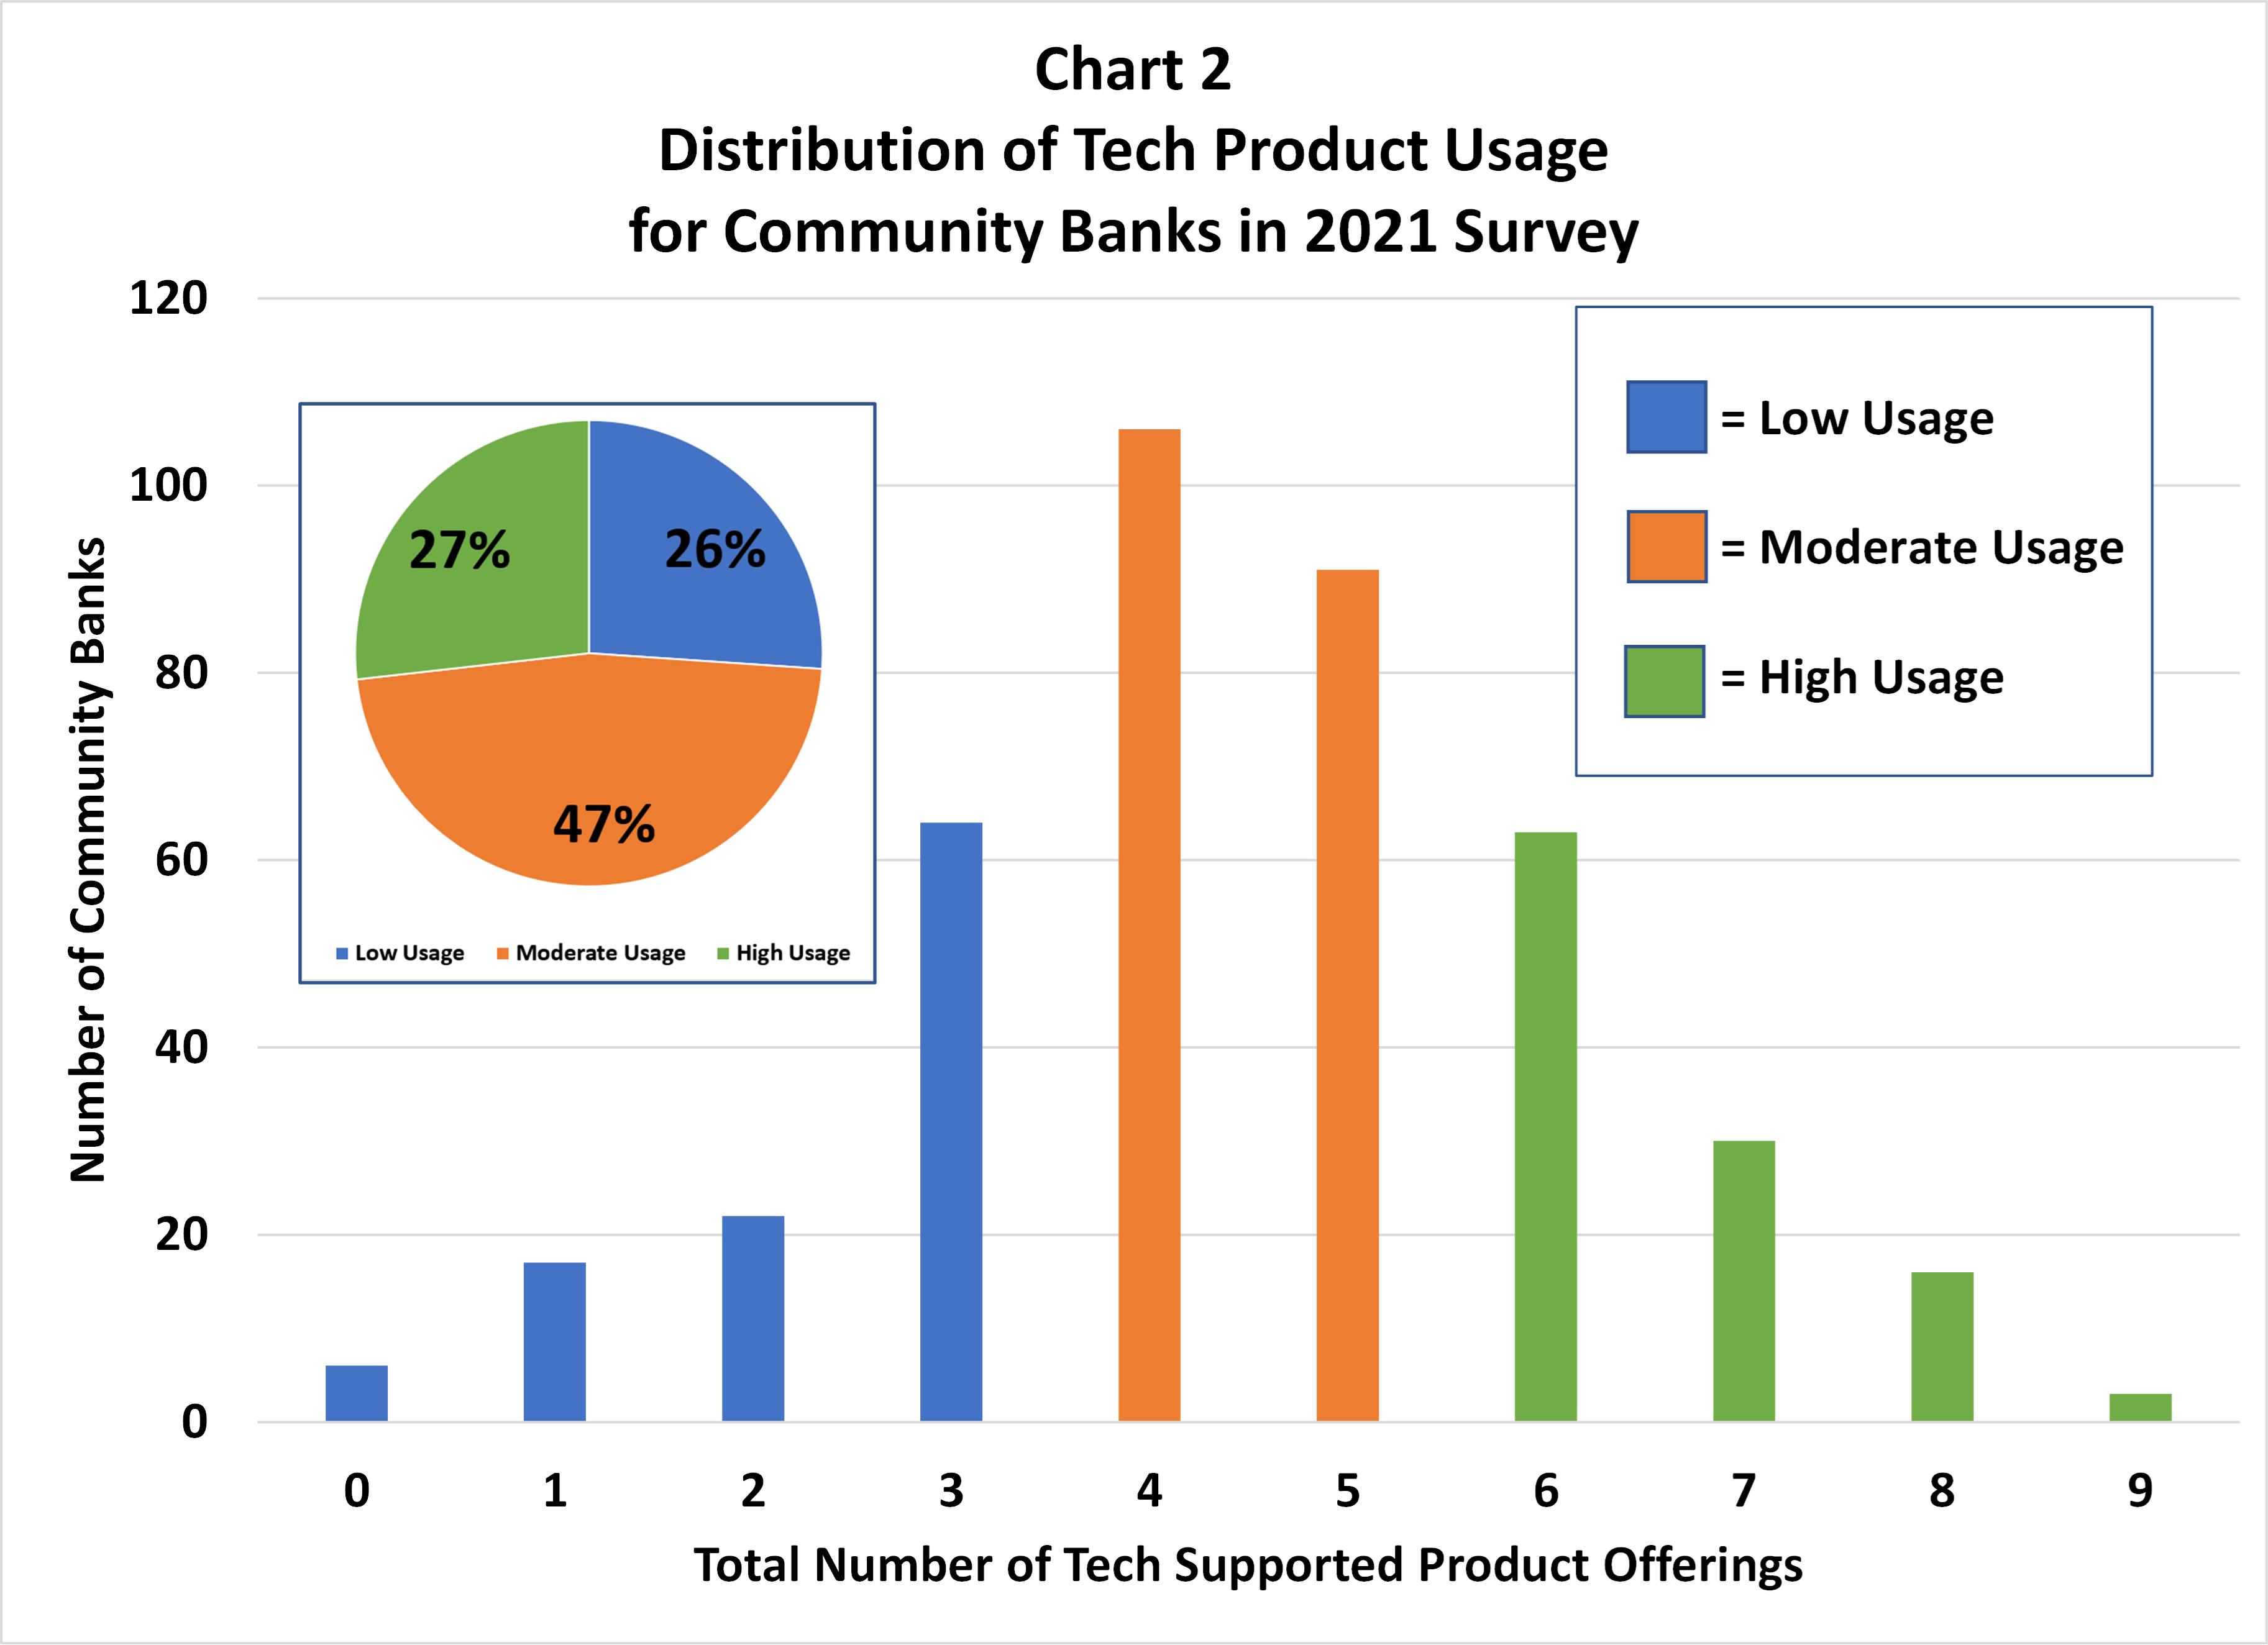
Grouping community banks by their intensity of technology adoption is a workable proxy for tech sophistication. Banks that offer more of these products should have a more complete platform that enables them to better compete with larger banks or fintech firms. This definition does have a weakness; some products may require more investment in technology than others (e.g., online underwriting), and a simple numerical summation of the number of product offerings may not capture true technological sophistication.
Characteristics of High Tech-Usage Firms
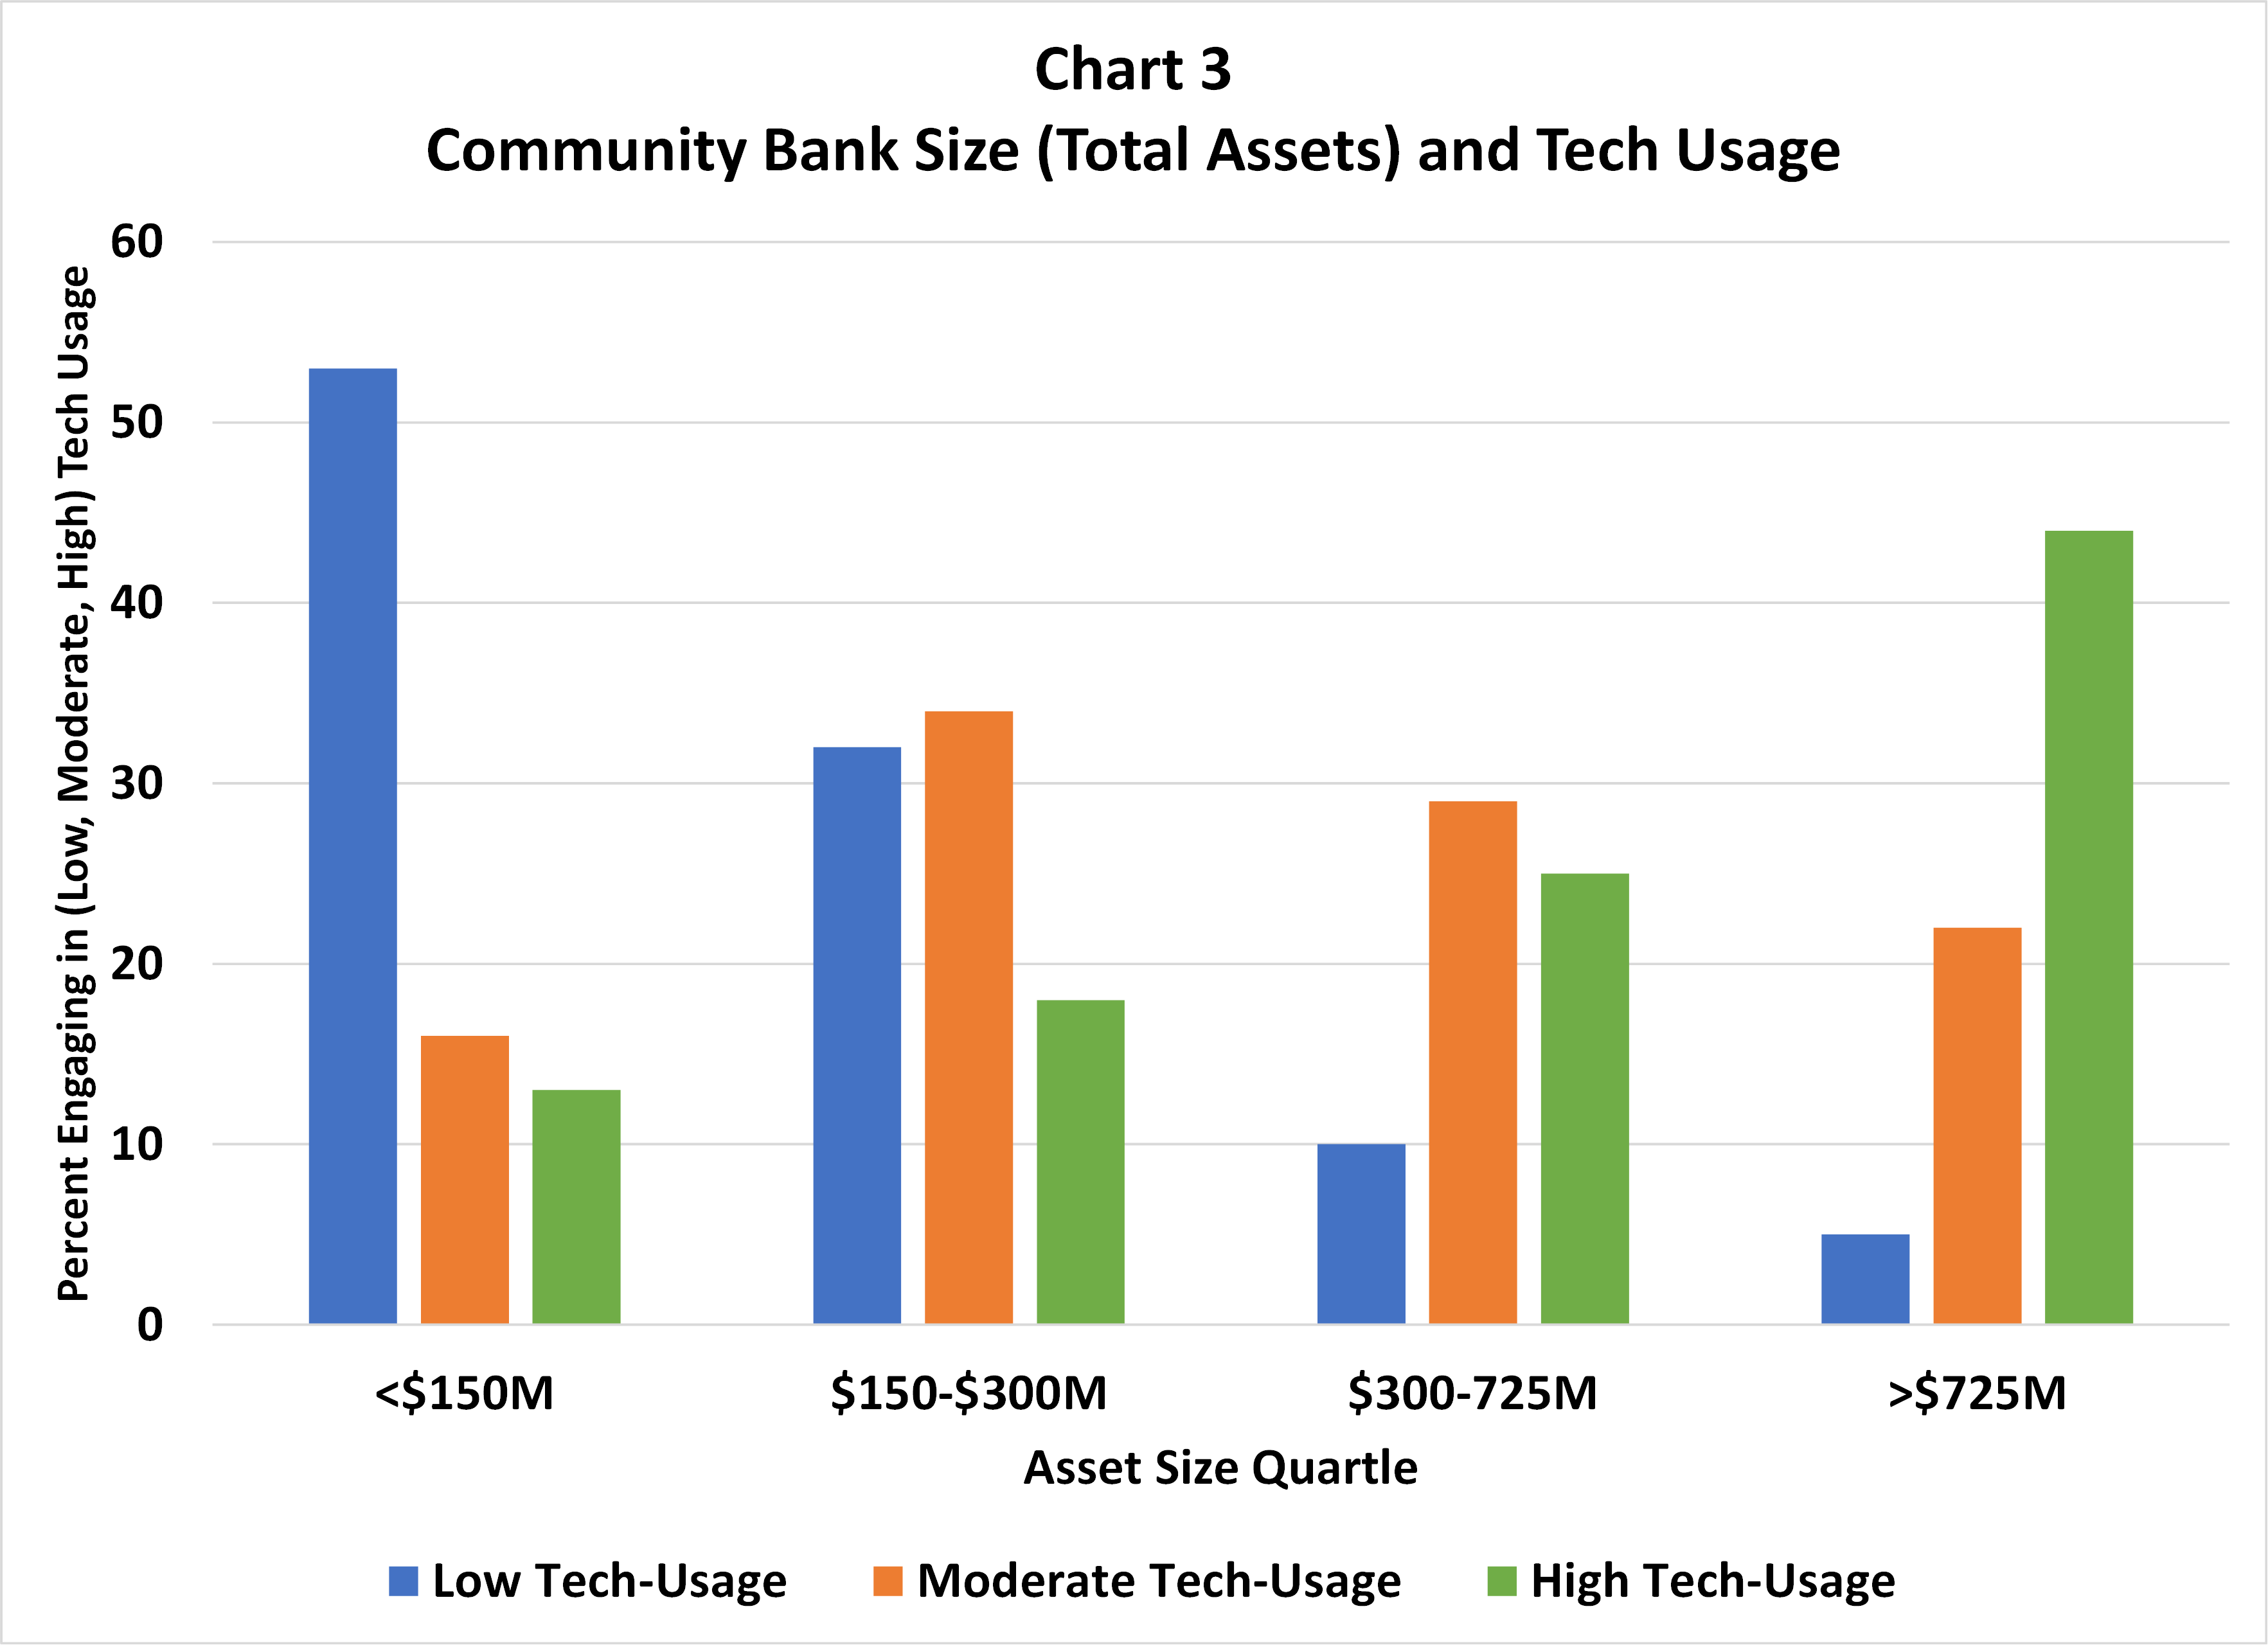
Who are the high tech-usage community banks? As shown in Chart 3, community banks in the top quartile of total assets (greater than $750 million as of December 31, 2020) are much more likely to engage in high tech-usage (44% versus 26% overall), while those in the lowest asset size quartile (less than $150 million) are more likely to engage in low tech-usage (53% versus 23% overall). This outcome is consistent with the view that economies of scale are important in tech investment to offer tech supported products.
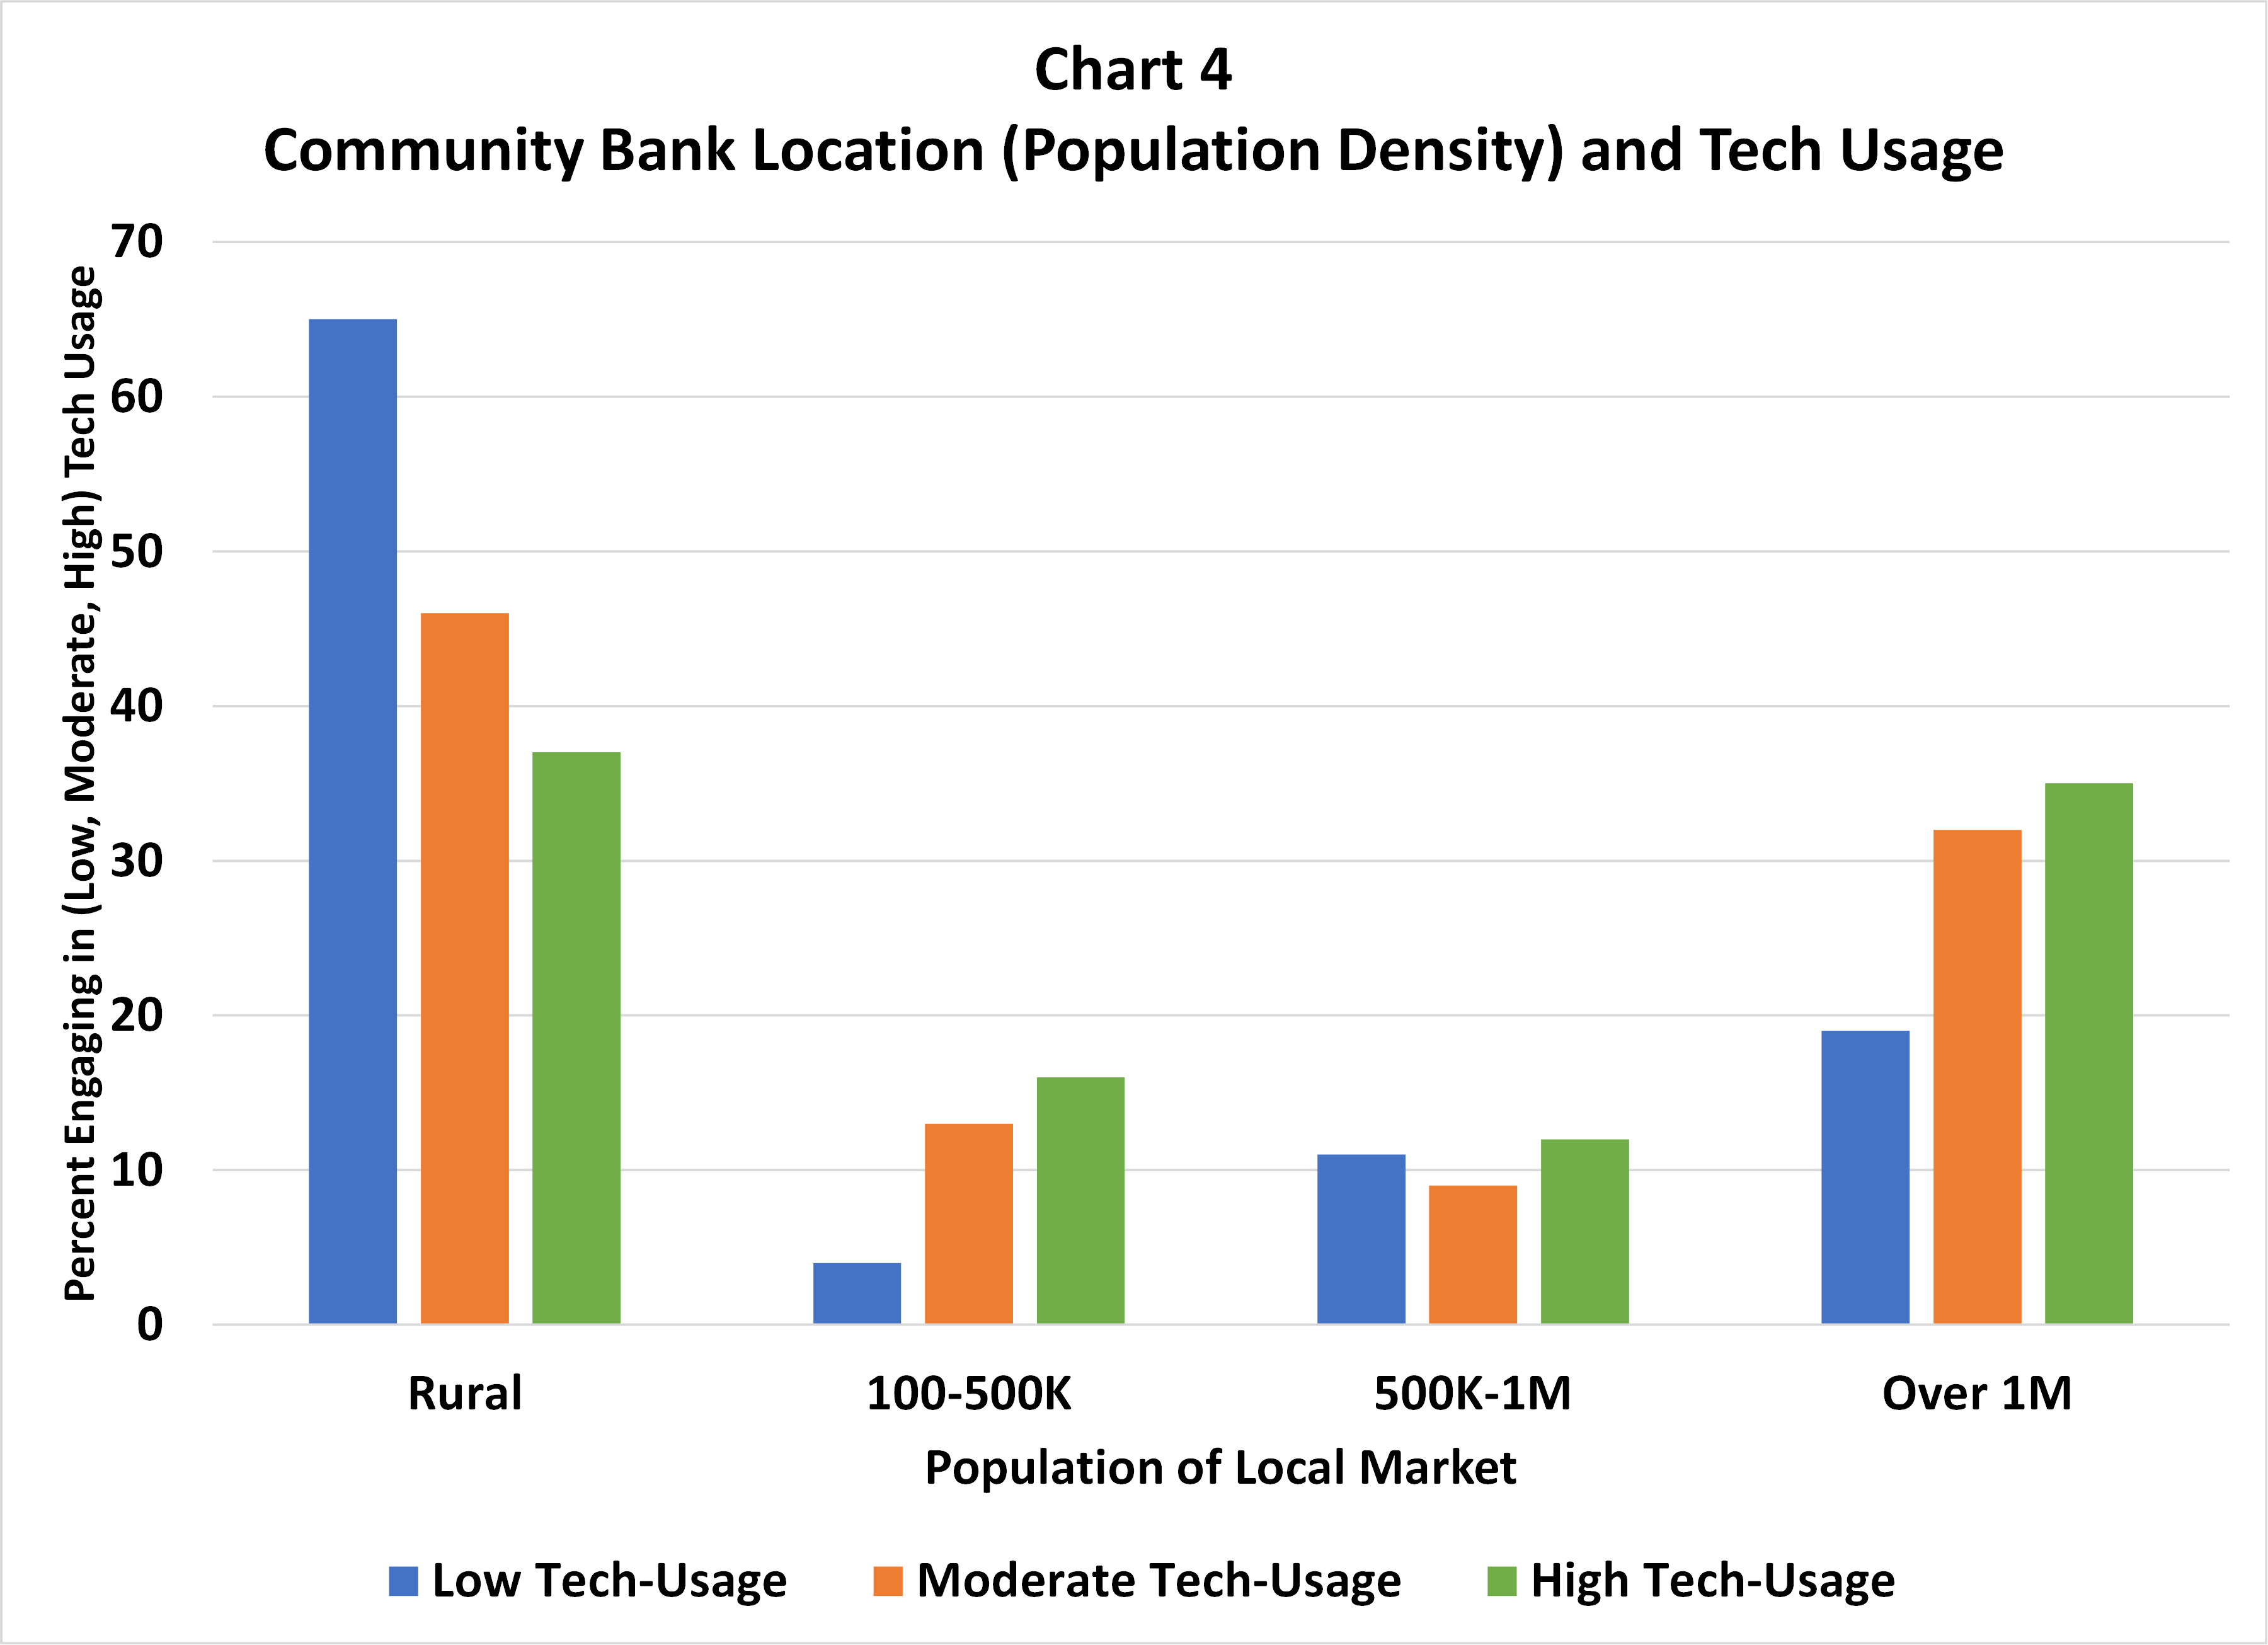
Location also matters. Chart 4 shows that community banks in Combined Statistical Areas with populations greater than one million are more likely to report moderate to high tech-usage, while those in rural areas are more likely to report low tech-usage (65% versus 47% overall). Location by population density is a good proxy for broadband availability and likely facilitates greater demand for digital banking products.
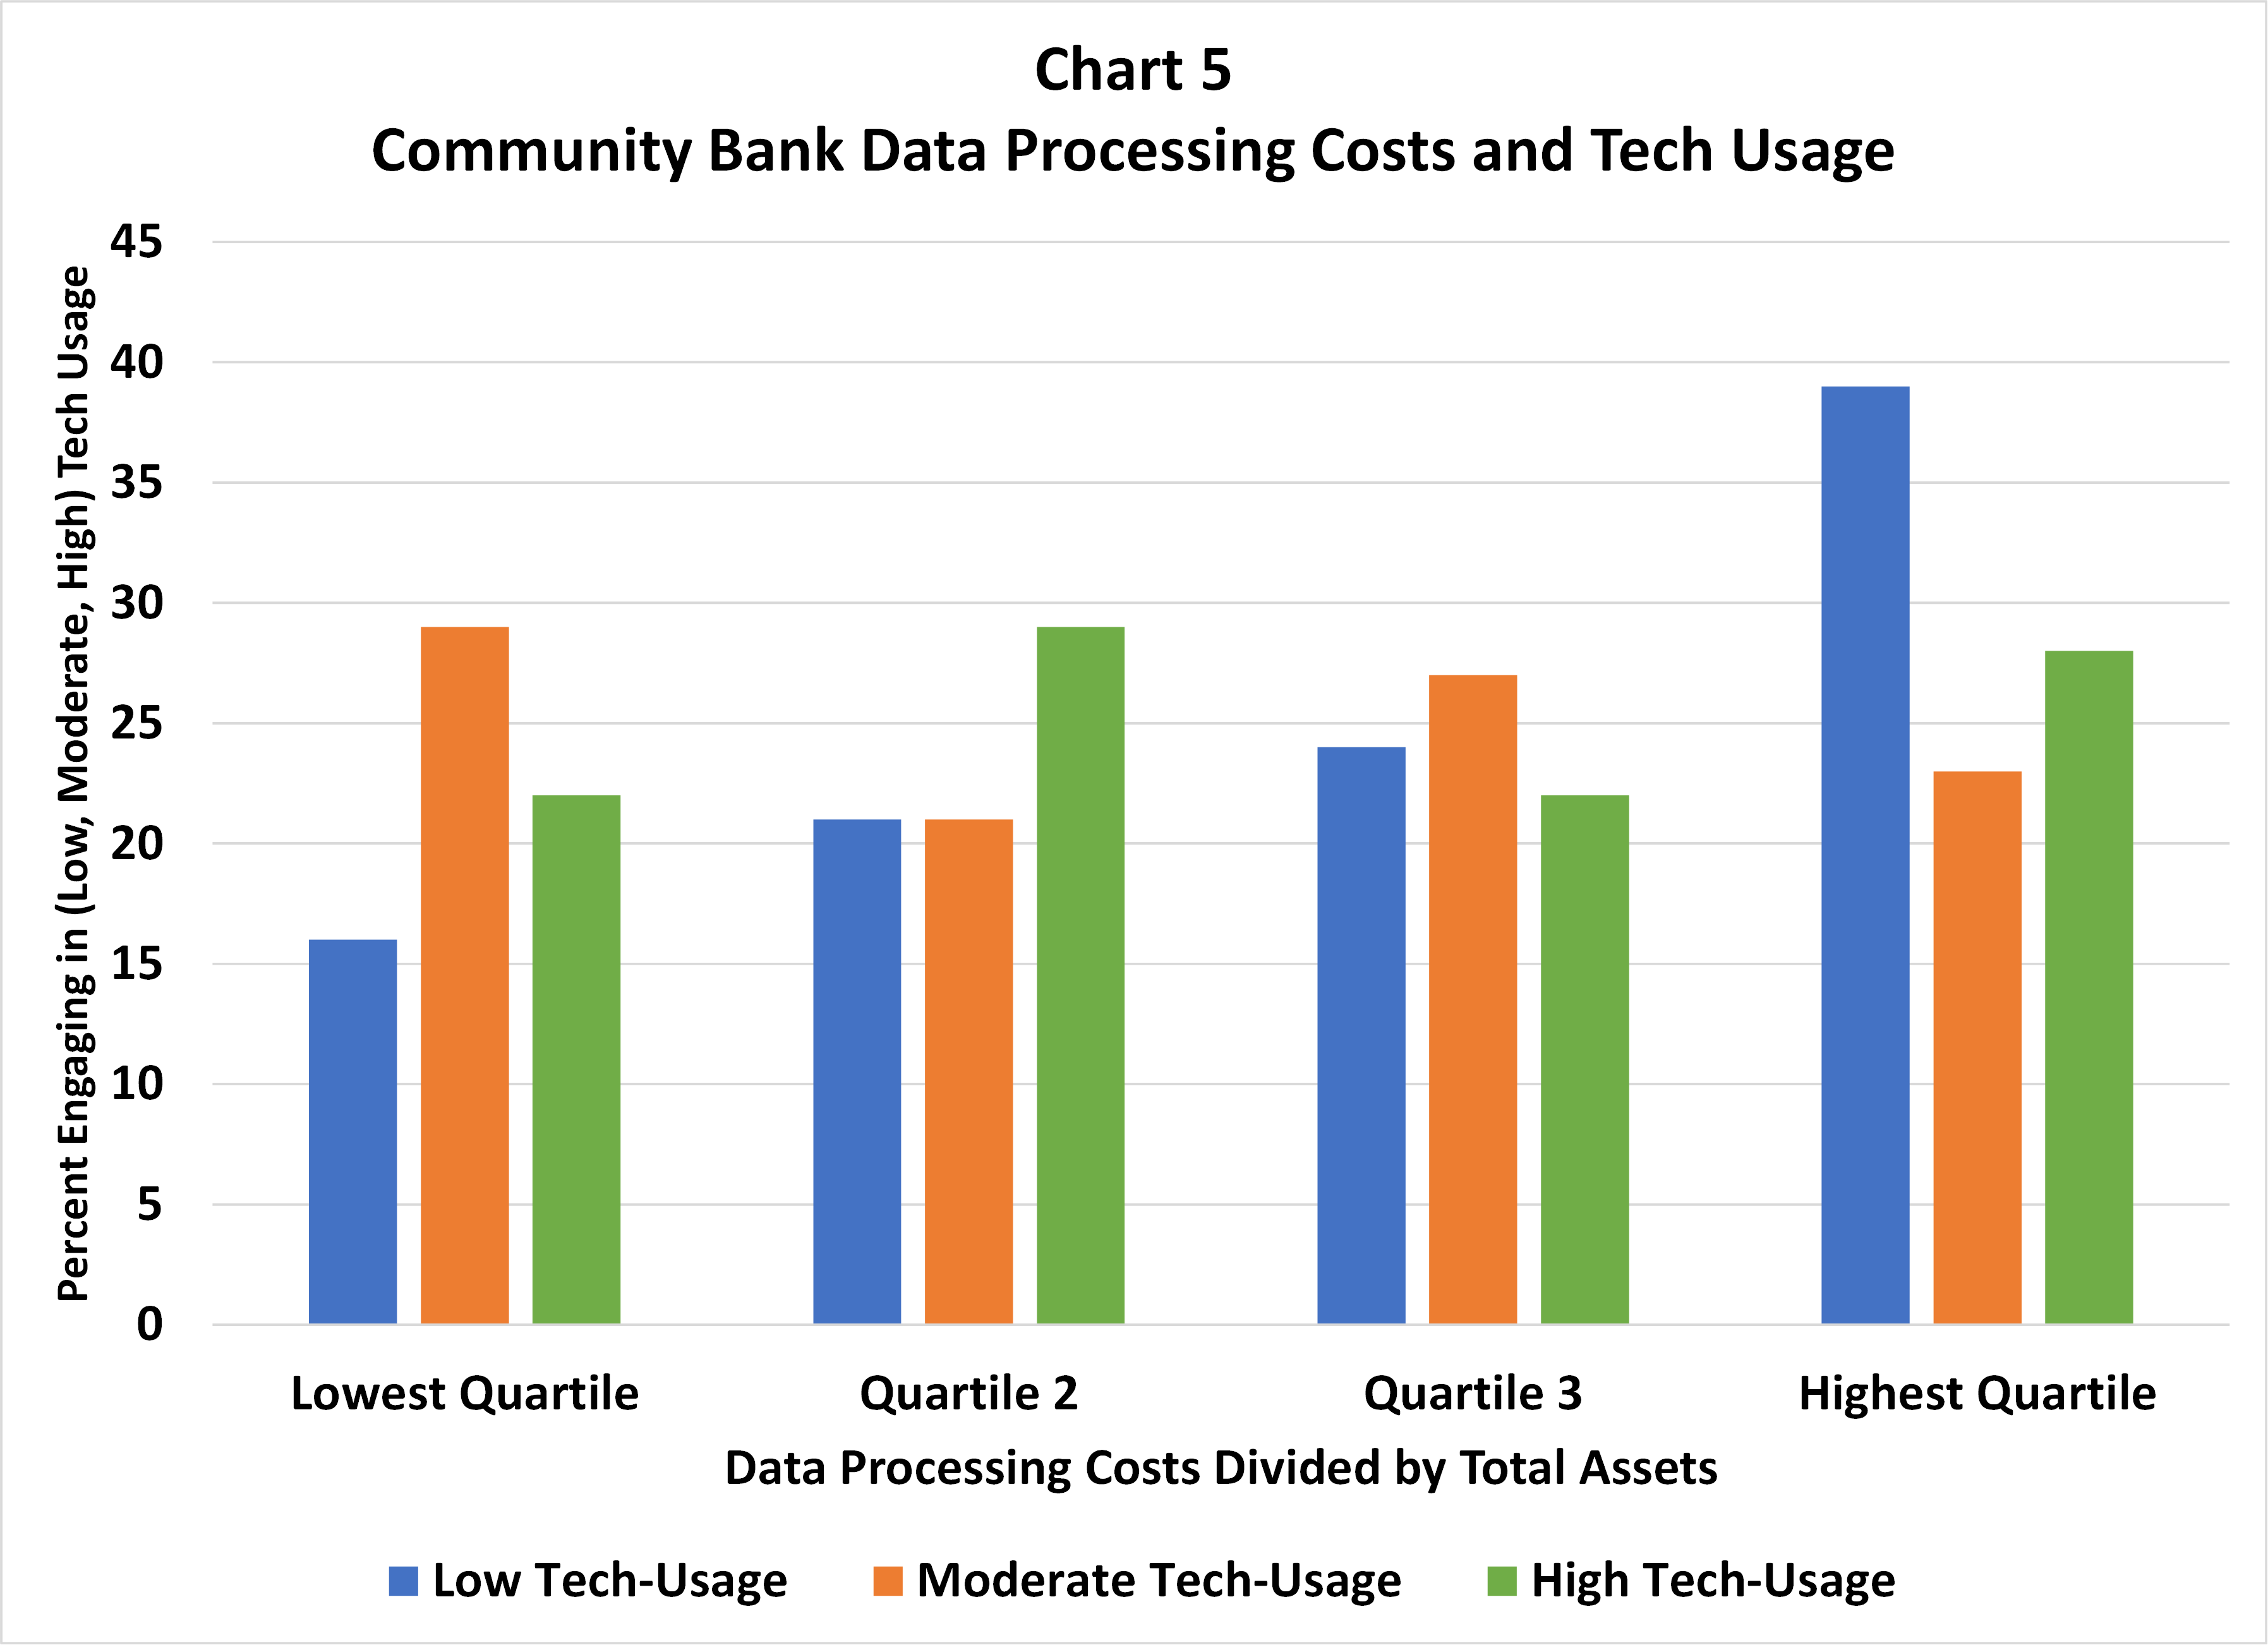
Increased technology investment should result in greater economies of scale. One proxy for scale is data processing costs divided by total assets, where a low ratio indicates greater economies of scale than a higher ratio. This ratio is a reasonable proxy for economies of scale because tech investment should ultimately result in an increased book of business. Its weakness, however, is that it ignores the impact of tech investment in products and services that generate non-interest income as well as the other costs, especially compensation, needed to support tech investment. Nonetheless, we compared tech usage to this ratio and found that just 16% of low tech-usage firms were in the lowest quartile of data processing costs divided by total assets, while 39% of these same firms were in the highest quartile (see Chart 5).
We also examined other potential drivers and correlates for community bank tech usage and did not find significant differences. For example, tech usage at community banks does not appear to vary by who they view as their primary competitor, or by whether they offer cryptocurrencies, or by their use of data science tools in marketing, or the use of natural language processing for compliance, or lending partnerships with fintech firms.
Conclusion
Community banks’ use of various technologies has increased over the past four years. Community banks reporting the highest tech-usage tend to be larger (as measured by total assets), located in more populated areas and appear to have greater economies of scale.
In our next blog, we examine how community bankers view technology.
 Press Releases
Community Banker Optimism Reaches New High
Oct 2, 2025
 Blog post
Letter of Appreciation to Jonathan A. Scott
Aug 20, 2025
 Press Releases
Community Bankers Maintain Positive Economic Outlook
Jul 8, 2025
Get Updates
Subscribe to CSBS
Stay up to date with the CSBS newsletter